
What Months of Supply Actually Tells You About the Housing Market

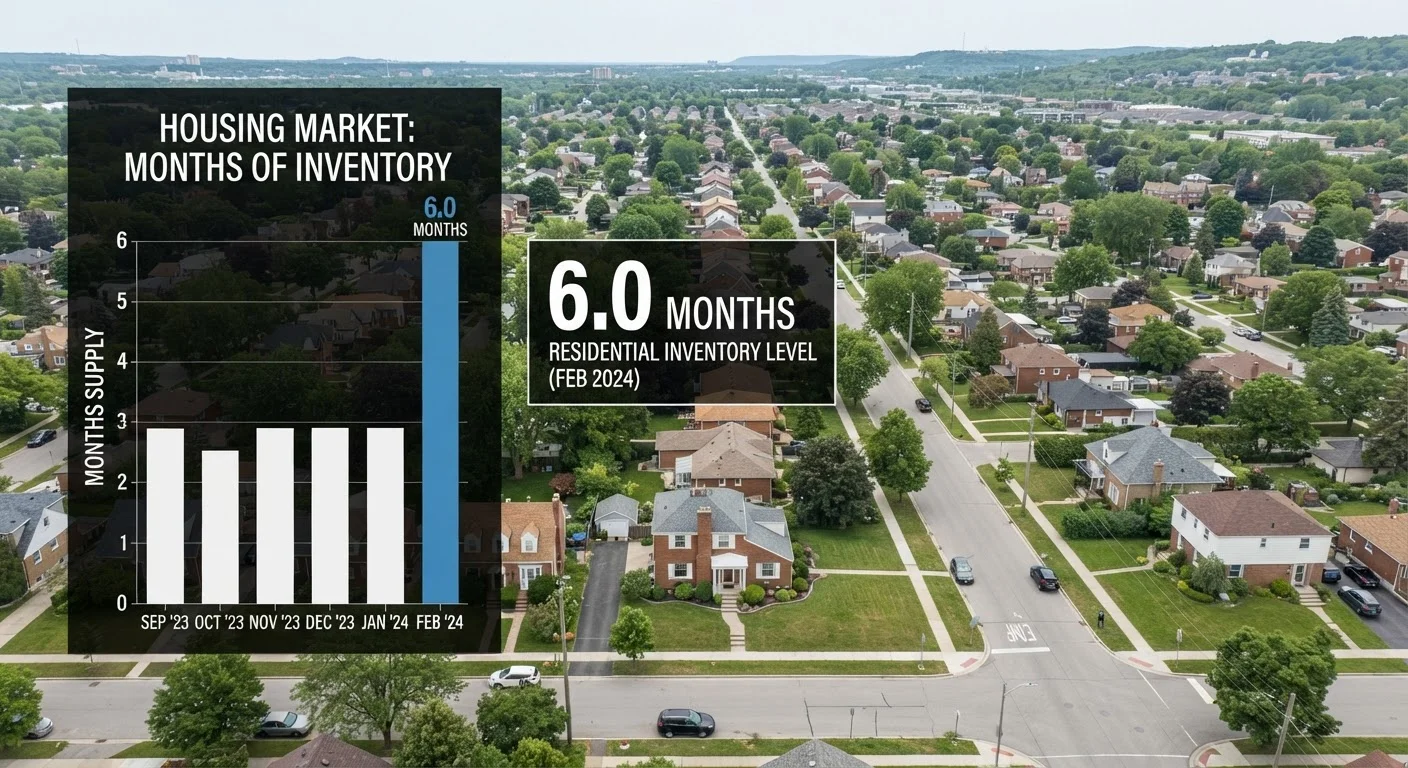
Photo: AskSpecialist.net editorial
Key Takeaways
- Six months of supply is the widely accepted benchmark for a balanced housing market.
- Below six months signals a seller's market; above six months signals a buyer's market.
- Months of supply is calculated by dividing active listings by average monthly sales.
- The metric is most useful when compared to local historical averages, not just national figures.
- Rapid changes in months of supply often precede shifts in home prices and days on market.
The Formula Behind the Figure
Months of supply is derived from a straightforward calculation: take the total number of active listings in a market, then divide by the average number of homes sold per month. If a market has 900 active listings and closes 150 sales per month, the result is six months of supply.
What makes the metric useful is what that number implies. It assumes sales continue at their current pace with zero new listings entering the market - a hypothetical that strips away noise and reveals raw inventory pressure. For a fuller picture of how this metric fits alongside other signals, see indicators worth watching when timing a real estate decision.
6 months
Balanced market benchmark for housing supply
A six-month supply of homes is the long-established industry threshold separating buyer's and seller's market conditions, as cited by the National Association of Realtors.
< 3 months
Supply level associated with rapid price appreciation
Housing economists broadly observe that sustained supply below three months has historically correlated with above-average home price growth in affected markets.
2
Key data points needed to calculate months of supply
Active listing count and average monthly closed sales are the only inputs required - both are publicly reported by local MLS boards and national associations.
What the Numbers Actually Signal
The industry standard benchmark is six months of supply, representing equilibrium between buyer demand and seller availability. Below that threshold, sellers hold the advantage: homes move quickly, multiple offers become common, and prices tend to rise. Above six months, buyers gain leverage - they have more choices, more time, and more room to negotiate.
These zones are not rigid. A market at 5.8 months is materially different from one at 2.1 months, even though both fall below six. Context matters. A sudden drop from eight months to five months signals accelerating demand far more meaningfully than a stable reading at 4.5 months over two years.
For related context on what constrained supply means specifically for buyers and sellers navigating a transaction, see what low housing inventory really means.
Reading the Metric Locally vs. Nationally
National months-of-supply figures - published regularly by the National Association of Realtors and other housing research organizations - provide useful baseline context. But real estate is intensely local, and national averages can obscure sharp divergences. A market like Austin, Texas may sit at two months of supply while a Rust Belt market sits at nine, even when the national number reads a comfortable five.
This is why real estate professionals advise looking at local MLS data, often broken down by price tier or zip code. A $250,000 starter-home segment and a $1.2 million luxury segment in the same metro can show dramatically different months-of-supply figures - and therefore different negotiating dynamics - simultaneously.
“The months-of-supply figure is one of the most telling single numbers in housing data. It condenses complex supply and demand dynamics into something any consumer can quickly interpret and use.”
— Lawrence Yun, Chief Economist, National Association of Realtors
How Months of Supply Fits With Other Market Indicators
Months of supply is most powerful when read alongside complementary metrics. Days on market measures how long individual listings sit before going under contract - a ground-level view of demand that confirms or challenges what months of supply suggests at the aggregate level. When both figures drop simultaneously, the market signal is especially strong.
Price trend data, pending sales counts, and list-to-sale price ratios round out the picture. No single number tells the full story. For a broader glossary of the terms you'll encounter while tracking the housing market, the housing market terms you'll see in every news headline resource covers the full vocabulary in plain language.
Understanding months of supply doesn't predict the future of home prices with certainty - no metric does. But it gives buyers, sellers, and observers a grounded, data-driven way to assess whether conditions favor their position right now, and to spot meaningful shifts as they emerge.
Frequently Asked Questions
The content on this site is provided for informational purposes only and should not be considered a substitute for professional advice. While we strive to provide accurate and up-to-date information, we make no guarantees regarding its completeness or accuracy. Always consult a qualified professional for advice specific to your circumstances before making any decisions.