
Median Home Price vs. Average Home Price: Why the Gap Matters

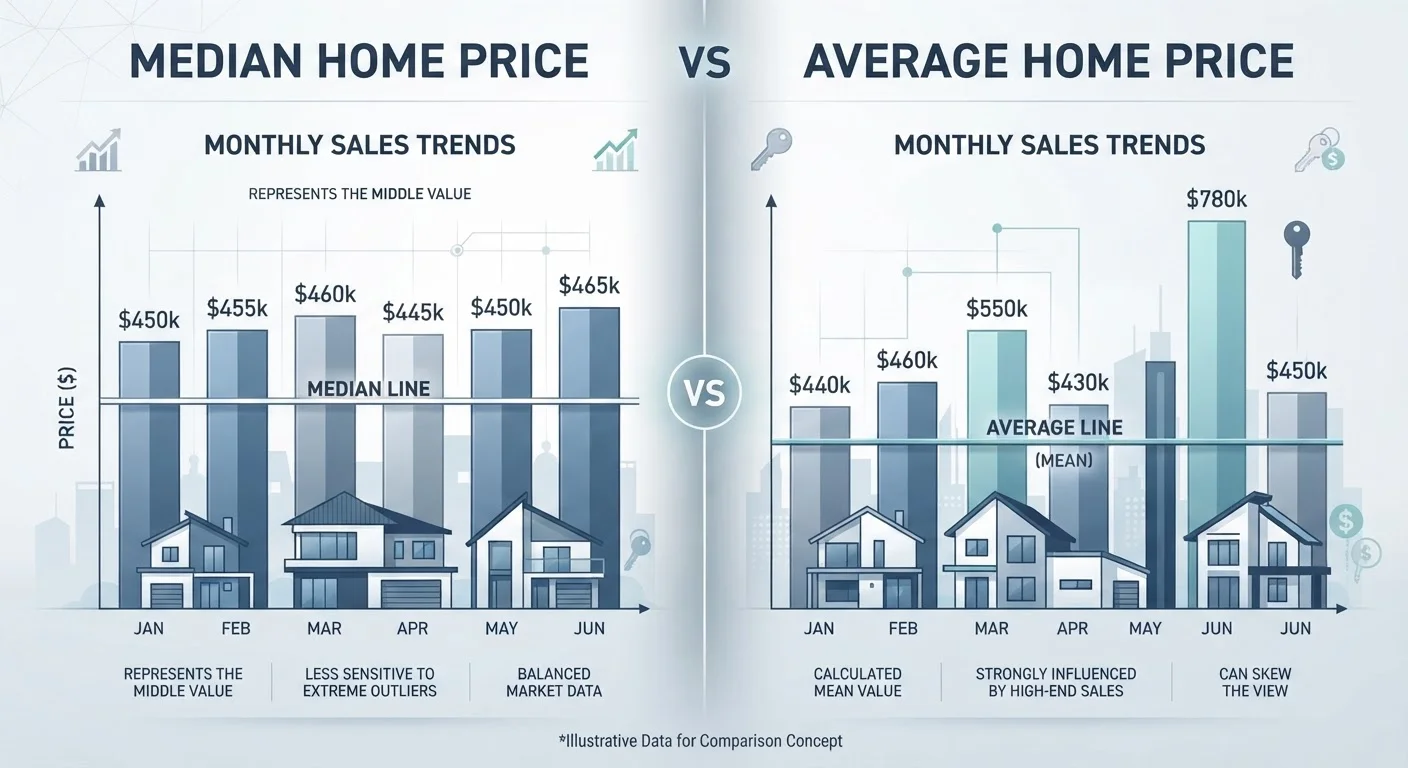
Photo: AskSpecialist.net editorial
Key Takeaways
- The median home price is the midpoint of all sales; half sold for more, half sold for less.
- The average home price is the total sales volume divided by the number of transactions.
- A handful of very high-priced sales can significantly inflate the average without affecting the median.
- The gap between median and average often signals how skewed a local market is toward luxury sales.
- For most homebuyers, the median is the more practical number for budgeting and market comparison.
- Neither figure alone tells the full story - context and local data are essential.
How Each Number Is Calculated
The median home price is found by ranking all home sales in a given period from lowest to highest and identifying the sale that falls exactly in the middle. If there are 101 sales, the median is the 51st value. It is not influenced by whether the cheapest homes sold for $80,000 or the priciest sold for $4 million - those extremes simply end up on either side of the midpoint.
The average home price - sometimes called the mean - is calculated differently. Add up the total dollar value of every sale in the period, then divide by the number of transactions. A single $10 million mansion closing in an otherwise modest suburb will raise the average for every buyer reading that week's market report, even though most of those buyers have no realistic shot at that property.
This mathematical distinction is not a technicality. It is the entire reason the two numbers can diverge sharply in the same market during the same month. Misreading which figure applies to your situation is one of the most common data errors everyday buyers make.
| Criterion | Median Home Price | Average Home Price |
|---|---|---|
| How it's calculated | Middle value in a ranked list of sales | Total sales value ÷ number of transactions |
| Sensitivity to outliers | Low - extremes don't shift the midpoint | High - one luxury sale moves the figure |
| Best reflects | Typical buyer's market experience | Overall market dollar volume and skew |
| Most cited by | NAR, Redfin, Zillow in consumer reports | Economists, appraisers, broad analyses |
| Usefulness for budgeting | High for most homebuyers | Low - can overstate typical costs |
| Signals market skew | Not directly | Yes - gap vs. median reveals skewness |
Why the Gap Between Them Is Itself Informative
When median and average home prices in a market are close together, it generally indicates that sales are relatively evenly distributed - no dramatic cluster of ultra-luxury or distressed properties pulling the average away from the middle. When the gap is wide, it signals skewness: the presence of high-value outliers pushing the average upward while the median stays anchored to where most buyers actually transact.
A market where the average price is $650,000 but the median is $420,000 is telling you something important: a comparatively small number of expensive sales are doing heavy lifting on the average side. If you budget based on the average, you may misread how competitive the market truly is for a home in your price range.
$50K+
Typical average-vs-median gap in high-cost metros
In markets with active luxury segments, the spread between average and median sale prices frequently exceeds $50,000, according to housing data analysts.
~10%
Share of sales that can skew an average significantly
Research in statistical distribution shows that as few as the top 10% of high-value transactions can pull the arithmetic mean well above the median in a given dataset.
Understanding this gap is especially useful when evaluating whether a national headline applies to your local conditions. As we explore in our piece on national housing trends vs. local market conditions, broad figures can mask significant variation from one neighborhood to the next.
Which Figure to Use - and When
For most consumers - particularly those shopping for a primary residence - the median is the more actionable benchmark. It describes the market that the majority of buyers and sellers are operating in, free from the distortion of outliers. When the National Association of Realtors releases monthly existing-home sales data, the figure most widely cited is the median precisely because it is less susceptible to manipulation by a handful of extreme transactions.
The average, however, is not without value. Economists and housing analysts sometimes use it to track total market wealth effects or to assess how the high end of the market is performing relative to entry-level inventory. If you're trying to understand whether luxury demand is rising faster than mid-tier demand, watching the spread between average and median over time can be revealing.
Neither metric substitutes for knowing your specific market. Home prices are shaped by local supply, zoning, school districts, and economic drivers that no national statistic can capture. For a fuller picture, pair these figures with local days-on-market data and list-price-to-sale-price ratios. Understanding how these metrics interact with financing costs is also useful - see our coverage of why home prices don't move in lockstep with mortgage rates for that context.
When you encounter a headline claiming that home prices have surged or fallen by a specific percentage, your first question should be: which measure are they using? The answer shapes how much weight to give the number - and whether it reflects the market you're actually entering.
The content on this site is provided for informational purposes only and should not be considered a substitute for professional advice. While we strive to provide accurate and up-to-date information, we make no guarantees regarding its completeness or accuracy. Always consult a qualified professional for advice specific to your circumstances before making any decisions.